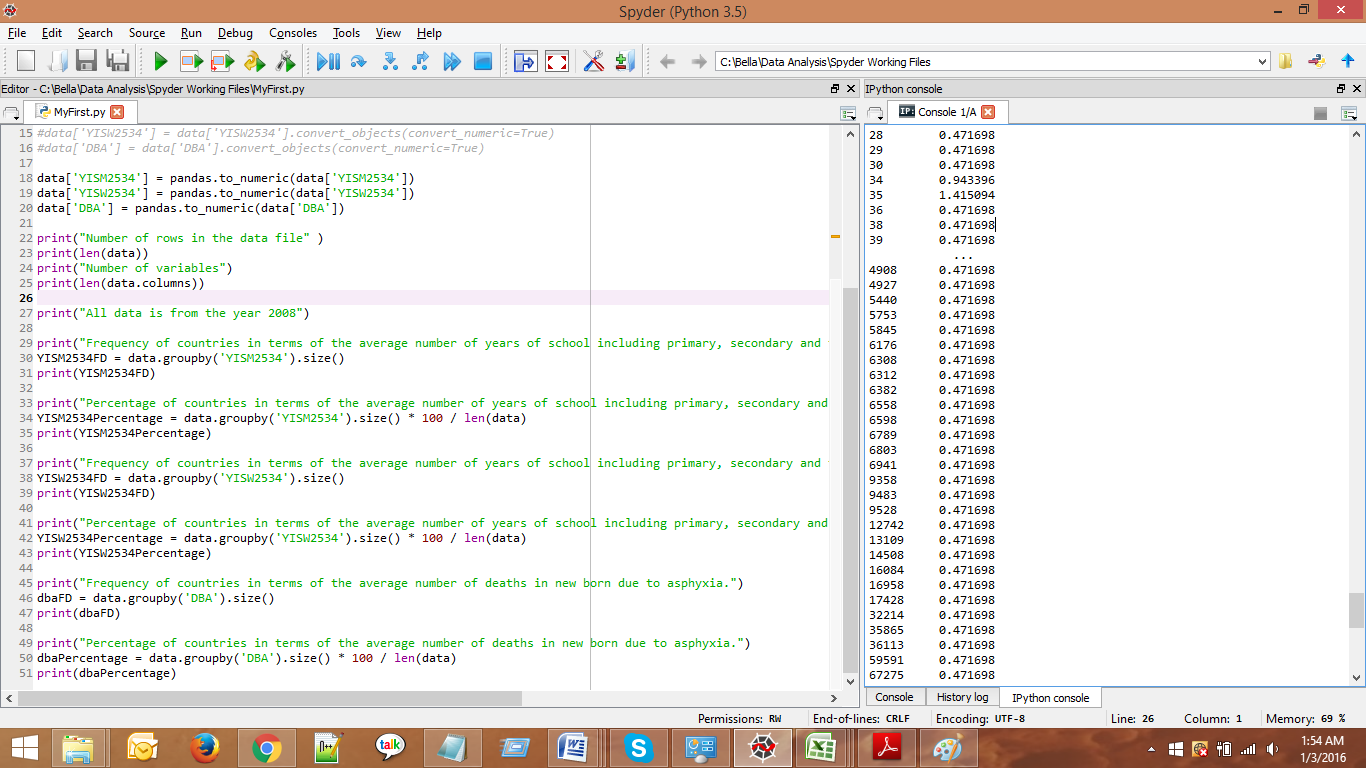
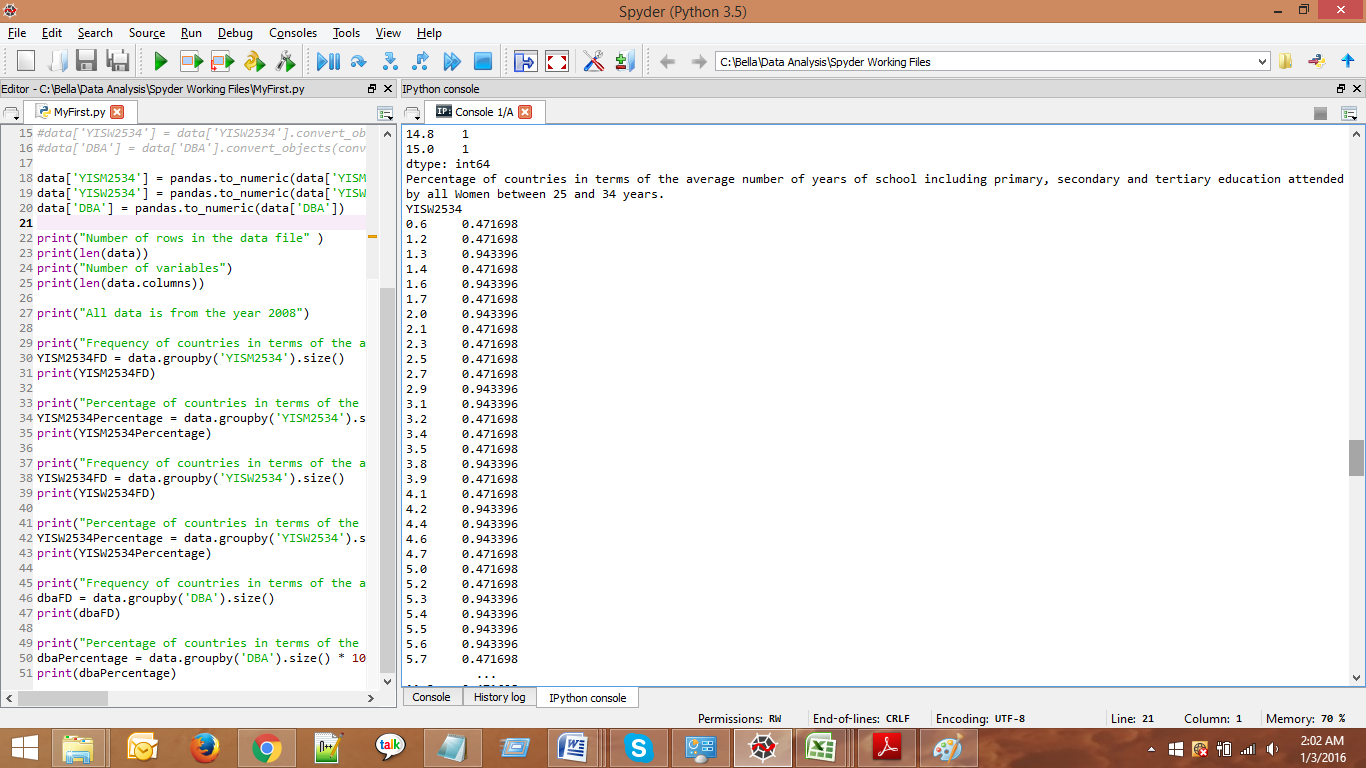
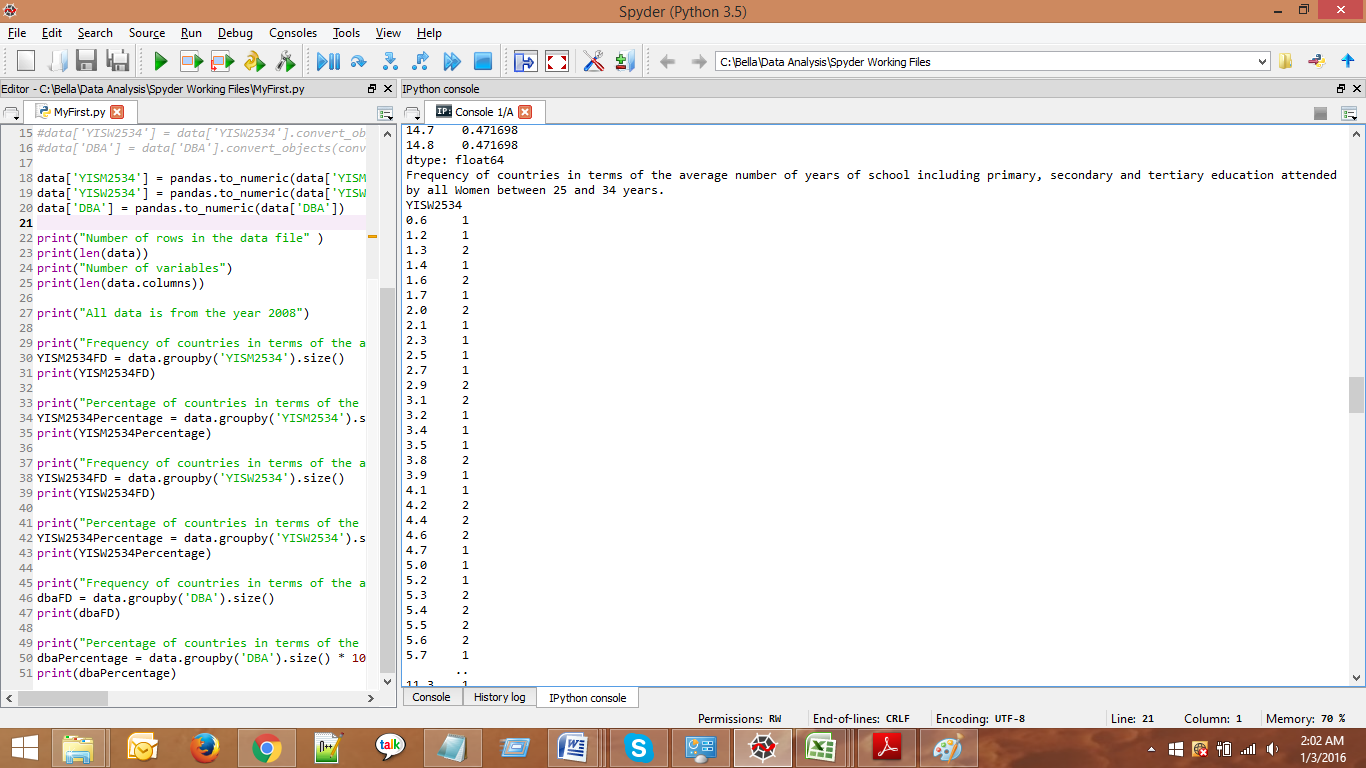
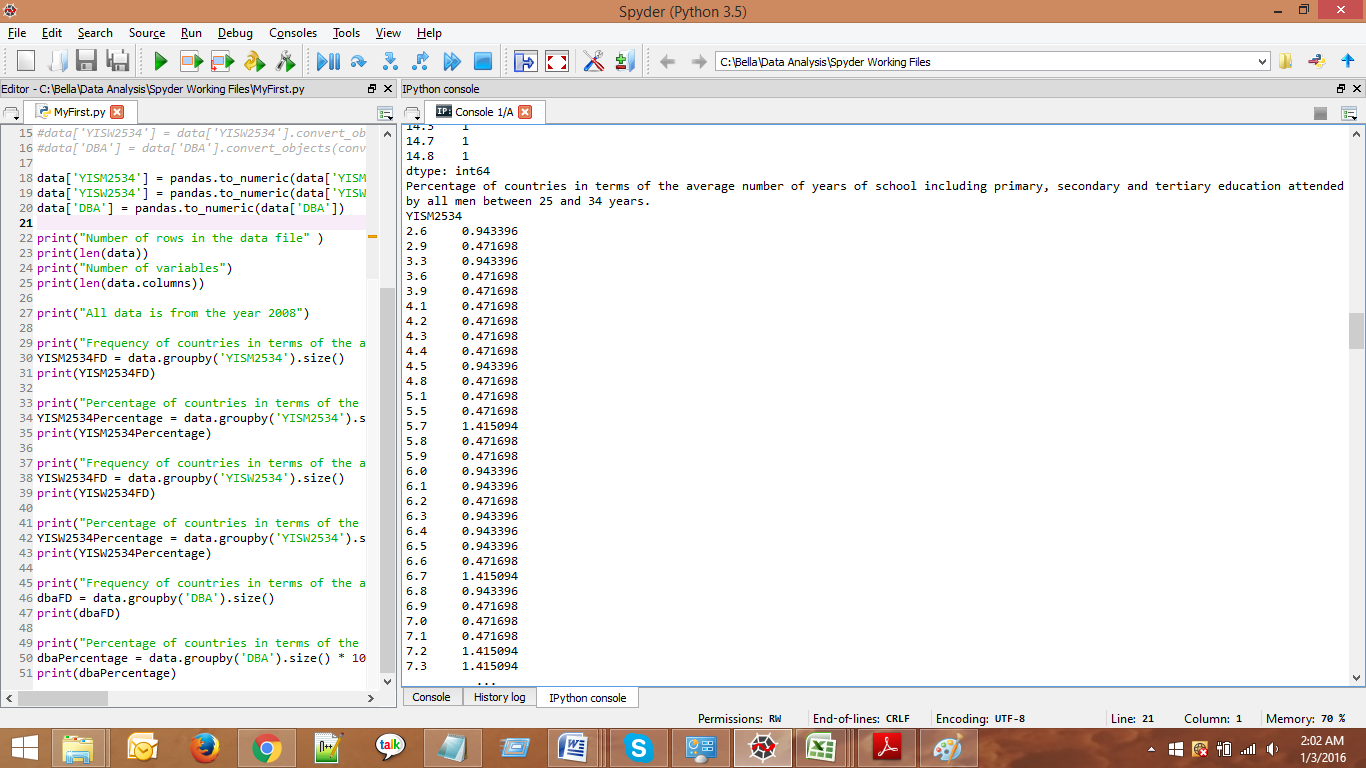
So this week, I wrote my first program in Python for analyzing frequency distribution of data. Unfortunately, the data I had selected did not lend well to frequency distribution. The main reason for this was that none of the variables in the data set was categorical. Therefore the results are not very meaningful at this point. Nevertheless, my first program did run without any errors and displayed the intended results.
My program:
# -*- coding: utf-8 -*-
“””
Spyder Editor
This is a temporary script file.
“””
# This is my “Hello World Code”
import pandas
import numpy
data = pandas.read_csv(‘data.csv’)
#data[‘YISM2534’] = data[‘YISM2534’].convert_objects(convert_numeric=True)
#data[‘YISW2534’] = data[‘YISW2534’].convert_objects(convert_numeric=True)
#data[‘DBA’] = data[‘DBA’].convert_objects(convert_numeric=True)
data[‘YISM2534’] = pandas.to_numeric(data[‘YISM2534’])
data[‘YISW2534’] = pandas.to_numeric(data[‘YISW2534’])
data[‘DBA’] = pandas.to_numeric(data[‘DBA’])
print(“Number of rows in the data file” )
print(len(data))
print(“Number of variables”)
print(len(data.columns))
print(“All data is from the year 2008”)
print(“Frequency of countries in terms of the average number of years of school including primary, secondary and tertiary education attended by all men between 25 and 34 years.”)
YISM2534FD = data.groupby(‘YISM2534’).size()
print(YISM2534FD)
print(“Percentage of countries in terms of the average number of years of school including primary, secondary and tertiary education attended by all men between 25 and 34 years.”)
YISM2534Percentage = data.groupby(‘YISM2534’).size() * 100 / len(data)
print(YISM2534Percentage)
print(“Frequency of countries in terms of the average number of years of school including primary, secondary and tertiary education attended by all Women between 25 and 34 years.”)
YISW2534FD = data.groupby(‘YISW2534’).size()
print(YISW2534FD)
print(“Percentage of countries in terms of the average number of years of school including primary, secondary and tertiary education attended by all Women between 25 and 34 years.”)
YISW2534Percentage = data.groupby(‘YISW2534’).size() * 100 / len(data)
print(YISW2534Percentage)
print(“Frequency of countries in terms of the average number of deaths in new born due to asphyxia.”)
dbaFD = data.groupby(‘DBA’).size()
print(dbaFD)
print(“Percentage of countries in terms of the average number of deaths in new born due to asphyxia.”)
dbaPercentage = data.groupby(‘DBA’).size() * 100 / len(data)
print(dbaPercentage)
Screen shot of the program
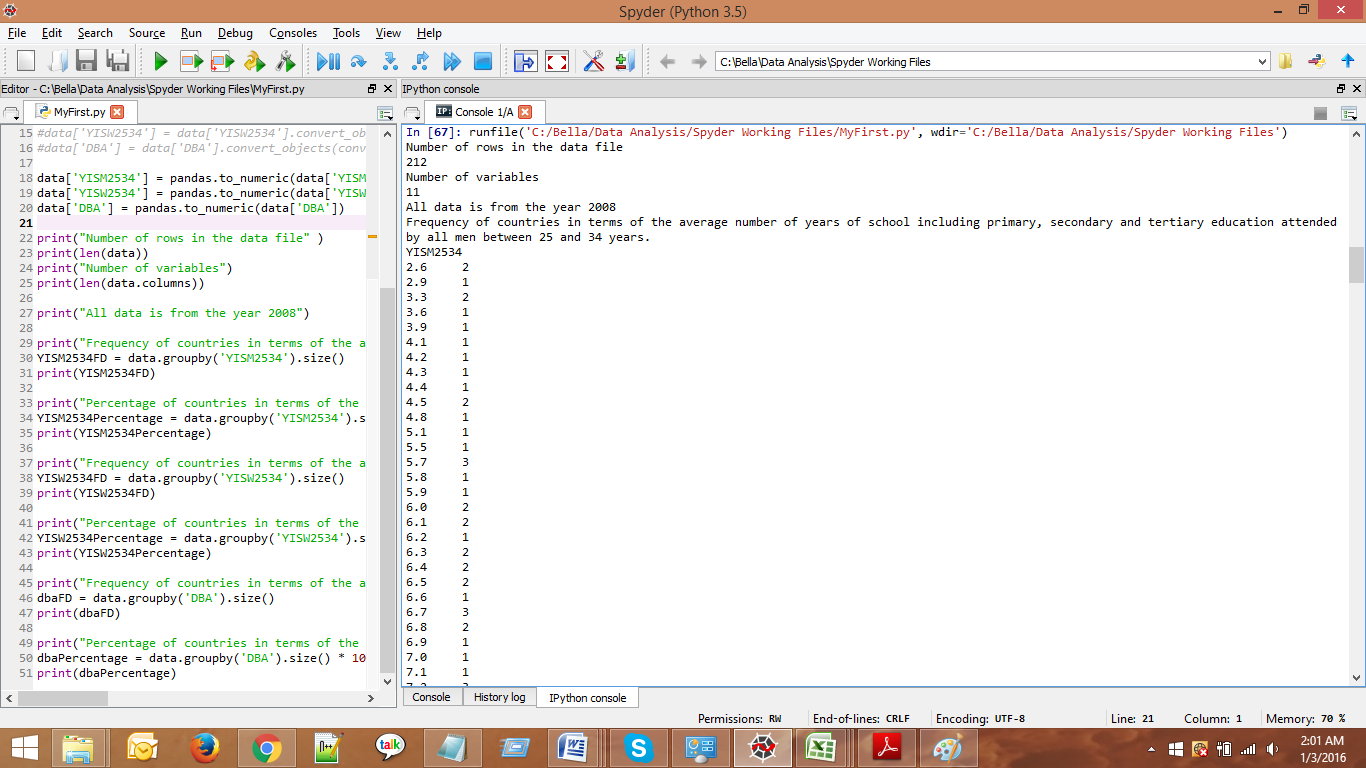
Results
runfile(‘C:/Bella/Data Analysis/Spyder Working Files/MyFirst.py’, wdir=’C:/Bella/Data Analysis/Spyder Working Files’)
Number of rows in the data file
212
Number of variables
11
All data is from the year 2008
Frequency of countries in terms of the average number of years of school including primary, secondary and tertiary education attended by all men between 25 and 34 years.
YISM2534
2.6 2
2.9 1
3.3 2
3.6 1
3.9 1
4.1 1
4.2 1
4.3 1
4.4 1
4.5 2
4.8 1
5.1 1
5.5 1
5.7 3
5.8 1
5.9 1
6.0 2
6.1 2
6.2 1
6.3 2
6.4 2
6.5 2
6.6 1
6.7 3
6.8 2
6.9 1
7.0 1
7.1 1
7.2 3
7.3 3
..
10.7 4
10.9 2
11.0 2
11.1 1
11.2 5
11.3 4
11.4 1
11.5 3
11.7 2
11.9 3
12.0 5
12.1 3
12.2 3
12.3 2
12.4 5
12.5 3
12.6 3
12.8 1
12.9 3
13.0 3
13.1 2
13.2 1
13.3 1
13.4 3
13.5 1
13.6 2
13.7 1
14.3 1
14.7 1
14.8 1
dtype: int64
Percentage of countries in terms of the average number of years of school including primary, secondary and tertiary education attended by all men between 25 and 34 years.
YISM2534
2.6 0.943396
2.9 0.471698
3.3 0.943396
3.6 0.471698
3.9 0.471698
4.1 0.471698
4.2 0.471698
4.3 0.471698
4.4 0.471698
4.5 0.943396
4.8 0.471698
5.1 0.471698
5.5 0.471698
5.7 1.415094
5.8 0.471698
5.9 0.471698
6.0 0.943396
6.1 0.943396
6.2 0.471698
6.3 0.943396
6.4 0.943396
6.5 0.943396
6.6 0.471698
6.7 1.415094
6.8 0.943396
6.9 0.471698
7.0 0.471698
7.1 0.471698
7.2 1.415094
7.3 1.415094
10.7 1.886792
10.9 0.943396
11.0 0.943396
11.1 0.471698
11.2 2.358491
11.3 1.886792
11.4 0.471698
11.5 1.415094
11.7 0.943396
11.9 1.415094
12.0 2.358491
12.1 1.415094
12.2 1.415094
12.3 0.943396
12.4 2.358491
12.5 1.415094
12.6 1.415094
12.8 0.471698
12.9 1.415094
13.0 1.415094
13.1 0.943396
13.2 0.471698
13.3 0.471698
13.4 1.415094
13.5 0.471698
13.6 0.943396
13.7 0.471698
14.3 0.471698
14.7 0.471698
14.8 0.471698
dtype: float64
Frequency of countries in terms of the average number of years of school including primary, secondary and tertiary education attended by all Women between 25 and 34 years.
YISW2534
0.6 1
1.2 1
1.3 2
1.4 1
1.6 2
1.7 1
2.0 2
2.1 1
2.3 1
2.5 1
2.7 1
2.9 2
3.1 2
3.2 1
3.4 1
3.5 1
3.8 2
3.9 1
4.1 1
4.2 2
4.4 2
4.6 2
4.7 1
5.0 1
5.2 1
5.3 2
5.4 2
5.5 2
5.6 2
5.7 1
..
11.3 1
11.4 2
11.5 3
11.6 3
11.7 1
11.8 3
11.9 1
12.0 2
12.1 4
12.2 3
12.3 3
12.4 4
12.5 3
12.6 3
12.7 1
12.8 2
12.9 2
13.0 3
13.1 3
13.2 2
13.3 3
13.4 1
13.5 2
13.6 1
13.7 3
13.8 3
13.9 1
14.5 1
14.8 1
15.0 1
dtype: int64
Percentage of countries in terms of the average number of years of school including primary, secondary and tertiary education attended by all Women between 25 and 34 years.
YISW2534
0.6 0.471698
1.2 0.471698
1.3 0.943396
1.4 0.471698
1.6 0.943396
1.7 0.471698
2.0 0.943396
2.1 0.471698
2.3 0.471698
2.5 0.471698
2.7 0.471698
2.9 0.943396
3.1 0.943396
3.2 0.471698
3.4 0.471698
3.5 0.471698
3.8 0.943396
3.9 0.471698
4.1 0.471698
4.2 0.943396
4.4 0.943396
4.6 0.943396
4.7 0.471698
5.0 0.471698
5.2 0.471698
5.3 0.943396
5.4 0.943396
5.5 0.943396
5.6 0.943396
5.7 0.471698
11.3 0.471698
11.4 0.943396
11.5 1.415094
11.6 1.415094
11.7 0.471698
11.8 1.415094
11.9 0.471698
12.0 0.943396
12.1 1.886792
12.2 1.415094
12.3 1.415094
12.4 1.886792
12.5 1.415094
12.6 1.415094
12.7 0.471698
12.8 0.943396
12.9 0.943396
13.0 1.415094
13.1 1.415094
13.2 0.943396
13.3 1.415094
13.4 0.471698
13.5 0.943396
13.6 0.471698
13.7 1.415094
13.8 1.415094
13.9 0.471698
14.5 0.471698
14.8 0.471698
15.0 0.471698
dtype: float64
Frequency of countries in terms of the average number of deaths in new born due to asphyxia.
DBA
0 1
1 4
2 2
3 1
4 5
6 1
7 2
8 3
9 1
11 1
12 2
13 1
14 2
15 1
16 2
17 1
20 1
21 2
22 1
23 2
24 1
26 3
28 1
29 1
30 1
34 2
35 3
36 1
38 1
39 1
..
4908 1
4927 1
5440 1
5753 1
5845 1
6176 1
6308 1
6312 1
6382 1
6558 1
6598 1
6789 1
6803 1
6941 1
9358 1
9483 1
9528 1
12742 1
13109 1
14508 1
16084 1
16958 1
17428 1
32214 1
35865 1
36113 1
59591 1
67275 1
84990 1
189447 1
dtype: int64
Percentage of countries in terms of the average number of deaths in new born due to asphyxia.
DBA
0 0.471698
1 1.886792
2 0.943396
3 0.471698
4 2.358491
6 0.471698
7 0.943396
8 1.415094
9 0.471698
11 0.471698
12 0.943396
13 0.471698
14 0.943396
15 0.471698
16 0.943396
17 0.471698
20 0.471698
21 0.943396
22 0.471698
23 0.943396
24 0.471698
26 1.415094
28 0.471698
29 0.471698
30 0.471698
34 0.943396
35 1.415094
36 0.471698
38 0.471698
39 0.471698
4908 0.471698
4927 0.471698
5440 0.471698
5753 0.471698
5845 0.471698
6176 0.471698
6308 0.471698
6312 0.471698
6382 0.471698
6558 0.471698
6598 0.471698
6789 0.471698
6803 0.471698
6941 0.471698
9358 0.471698
9483 0.471698
9528 0.471698
12742 0.471698
13109 0.471698
14508 0.471698
16084 0.471698
16958 0.471698
17428 0.471698
32214 0.471698
35865 0.471698
36113 0.471698
59591 0.471698
67275 0.471698
84990 0.471698
189447 0.471698
dtype: float64
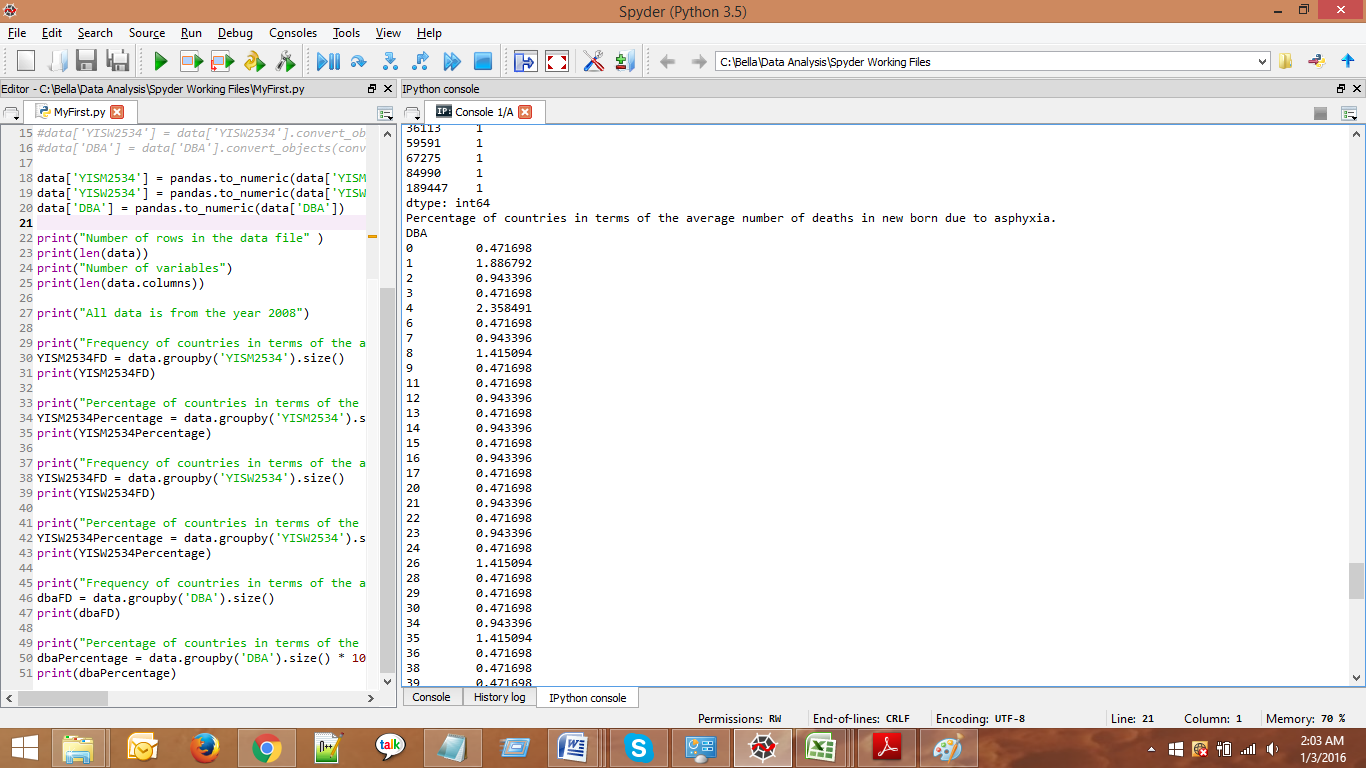
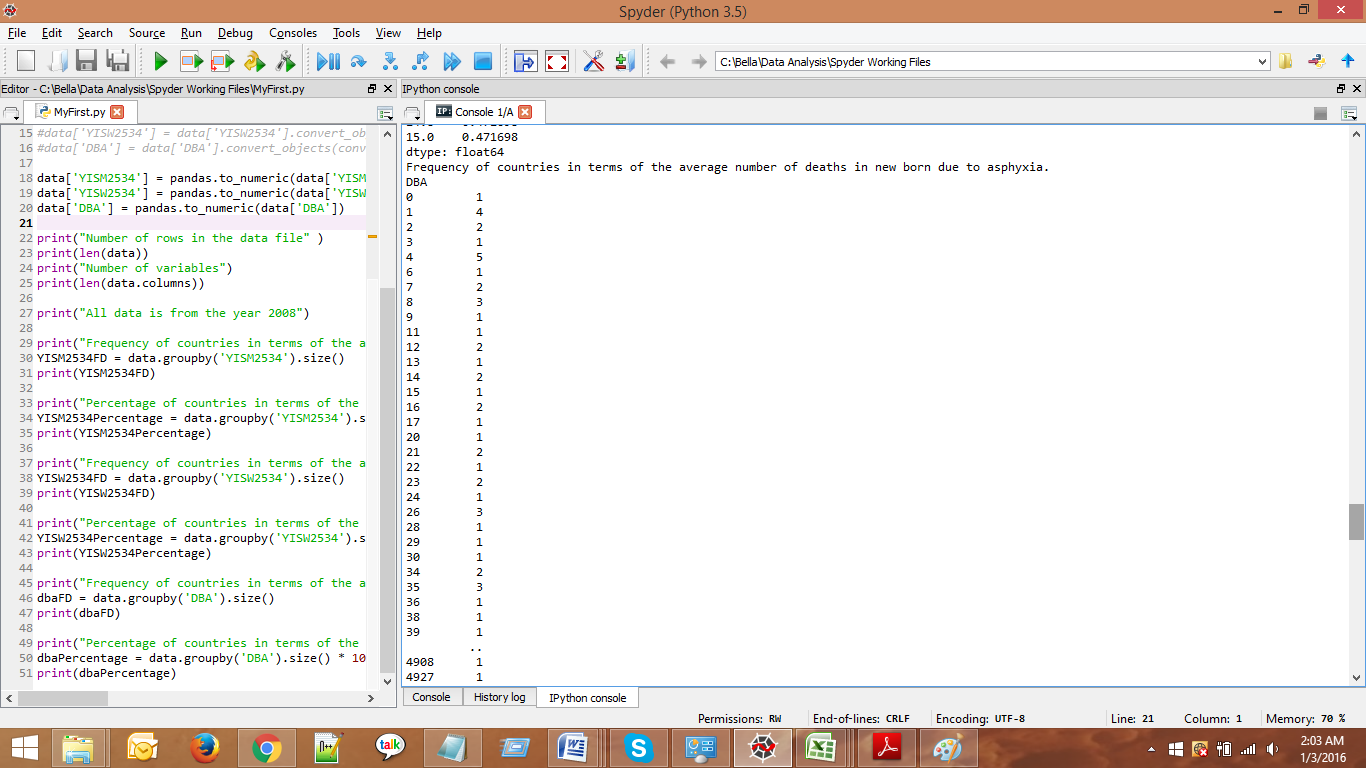
Screen shots of the results
In the above program, I have analyzed the frequency distribution of three variables:
YISM2534 :
| The average number of years of school attended by all people in the age and gender group specified, including primary, secondary and tertiary education. |
Since the variable takes an infinite number of values, it is not possible to summarize the results. Taking only the first three lines of the results (frequency and percentage) as a sample, it can be interpreted as follows:
YISM2534 (frequency)
2.6 2 (In two of the countries, the average years of education for men between the age group 25 and 34 is 2.6 years)
2.9 1 (In one country, the average years of education for men between the age group 25 and 34 is 2.9 years)
3.3 2 (In two of the countries, the average years of education for men between the age group 25 and 34 is 3.3 years)
—–
YISM2534 (Percentage)
2.6 0.943396 (In 0.94% of the countries, the average years of education for men is 2.6 years)
2.9 0.471698 (In 0.74% of the countries, the average years of education for men is 2.9 years)
3.3 0.943396 (In 0.94% of the countries, the average years of education for men is 3.3 years)
YISMW2534
| The average number of years of school attended by all people in the age and gender group specified, including primary, secondary and tertiary education. |
Since the variable takes an infinite number of values, it is not possible to summarize the results. Taking only the first three lines of the results (frequency and percentage) as a sample, it can be interpreted as follows:
YISM2534 (frequency)
0.6 1 (In one country, the average years of education for women between the age group 25 and 34 is 0.6 years)
1.2 1 (In one country, the average years of education for women between the age group 25 and 34 is 1.2 years)
1.3 2 (In two of the countries, the average years of education for women between the age group 25 and 34 is 1.3 years)
YISM2534 (Percentage)
0.6 0.471698 (In 0.47% of the countries, the average years of education for women is 0.6 years)
1.2 0.471698 (In 0.47% of the countries, the average years of education for women is 1.2 years)
1.3 0.943396 (In 0.94% of the countries, the average years of education for women is 1.3 years)
DBA:
| Number of new borns that died specifically of asphyxia |
Since this variable also takes an infinite number of values, it is not possible to summarize the results. Taking only the first three lines of the results (frequency and percentage) as a sample, it can be interpreted as follows:
DBA (frequency)
0 1 (In one country, the number of deaths by asphyxia is 0)
1 4 (In four of the countries, the number of deaths by asphyxia is 1)
2 2 (In two of the countries,the number of deaths by asphyxia is 2)
DBA (Percentage)
0 0.471698 (in 0.47% of the countries, there were 0 deaths by asphyxia)
1 1.886792 (in 1.8% of the countries, there was 1 deaths by asphyxia)
2 0.943396 (in 0.94% of the countries, there were 2 deaths by asphyxia)
As already mentioned, since none of the variables were categorical in nature, it was not possible to draw meaningful information from the data using only the frequency analysis.

