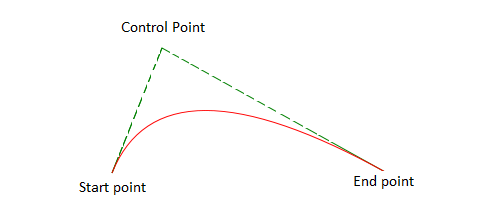
Unlinke a bezier curve, a quadratic
curve is defined by a start point, end point and only one control point.
The start point can be defined by the moveTo method. If this is one curve in a string of curves, then the start point is whereever the last curve ends.
To visualize how a quadratic curve
will look on screen, draw a line from the start point to the control point. Draw
another line from the end point to the control point. The quadratic curve will begin
at the start point, move in the direction of the control point ( in such a way that
the line from the start point to the control point is a tangent to the slope of
the curve) and end at the end point ( in such a way that the line from the end point
to the control point is a tangent to the slope of the curve).
Required Methods
You will need the following methods to draw an arc.
strokeStyle:
This method can be used to define the colour of any figure drawn on the canvas. Here, we will use it to define the colour of the curve
we are about to draw.
beginPath():
Calling this method will initialize a path. The path can be closed later with the
endPath() method and filled or stroked with the required colour. Without initializing
and closing a path, you will be unable to fill or stroke particular areas or lines
with specific colours.
moveTo():
This method is used to move the cursor/pen to a particular point on the canvas.
Here, the moveTo point will indicate the beginning of the bezier curve.
This method defines the quadratic curve, with the control point at (controlPointPointX,
controlPointY)and
end point (endPointX, endPointY).
stroke():
This method
draws the actual bezier curve.
<html>
<head>
<script type="application/javascript">
function init() {
var canvas = document.getElementById("canvas");
if (canvas.getContext) {
var ctx = canvas.getContext("2d");
//define the colour of the line.
ctx.strokeStyle = "green";
//Move to the beginning of the curve (100,100).
ctx.moveTo(100,100);
//Draw a line from the beginning point of the curve to the first control point (125,25).
//This line is only to help you visualize the curve easily.
ctx.lineTo(125,25);
ctx.stroke();
// Draw a line from the control point(125,25) to the end point of the curve (300,100)
// Again, this is only to help you visualize the curve easily.
ctx.lineTo(300,100);
ctx.stroke();
// Move to the beginning of the curve to (100,100) again, this time to draw the
quadratic
curve
ctx.moveTo(100,100);
ctx.strokeStyle = "red";
//define the quadratic curve.
ctx.quadraticCurveTo( 125,25,300,100)